Understanding the ICTContact Dashboard
The dashboard is the first screen you see after logging in as Admin. It gives you a real-time overview of your contact center’s performance — all in one place.
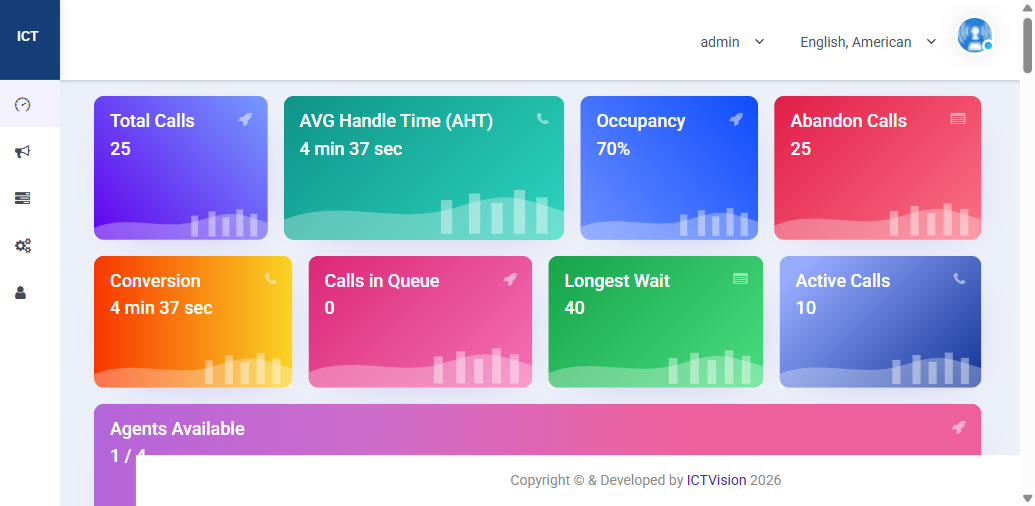
Dashboard Metric Cards
The top section shows 9 live metric cards. Here’s what each one means:
| Metric | What It Shows | Why It Matters |
|---|---|---|
| Total Calls | All calls handled today | Measures overall call volume |
| AVG Handle Time (AHT) | Average time per call including talk + wrap-up | Key efficiency metric — target under 6 minutes for most contact centers |
| Occupancy | % of time agents are actively on calls vs available | 70-85% is healthy; above 90% leads to agent burnout |
| Abandon Calls | Calls where the caller hung up before reaching an agent | High abandon rate means queue times are too long |
| Conversion | Average time to convert a contact | Tracks sales/campaign effectiveness |
| Calls in Queue | Callers currently waiting for an agent | Should stay near 0 — spikes mean you’re understaffed |
| Longest Wait | Longest wait time in the current queue | If above your SLA threshold, add agents or adjust routing |
| Active Calls | Calls happening right now | Real-time load indicator |
| Agents Available | Logged-in agents ready to take calls (e.g. 1/4) | Ratio of available vs total agents |
Call Statistics Chart
Below the metric cards, the Call Statistics chart shows call volume trends. Use the Day / Week / Month toggle to change the time range. This helps you spot peak hours and plan staffing.
Top Agents Table
Shows your highest-performing agents ranked by calls handled. Columns include Name, Calls Handled, Talk Time, and AHT. Use this for performance reviews and to identify coaching opportunities.
System Status & Server Status
The System Status panel shows:
- Total Logged-in Users — active admin/user sessions
- Total Active Campaigns — campaigns currently running
- Total Active Channels — simultaneous calls in progress
The Server Status panel confirms that MySQL, Apache, and Asterisk are all running. If any show as “Stopped”, contact your system administrator immediately.
Live Agent Statistics
At the bottom of the dashboard, the Live Agent Statistics table shows every logged-in agent with their current status (Free, On Call, On Break), talk time, occupancy, and break reason. Click any row to drill into that agent’s full statistics.
Recent Calls History
The Recent Calls History widget shows the last 3 calls with contact name, phone number, agent, elapsed time since the call, and the disposition. Click “View All” to open the full call history.
Node Statistics
Shows CPU, memory, and disk usage for each server node. If CPU or memory usage is consistently above 80%, contact your hosting provider to scale up resources.
Related: Agent/Extension Setup | Campaign Management | Full User Guide